Choose one of thirty outcomes to view the full sample, or compare it across one or two of twenty-two participant characteristics. Build detailed crosstabs or use the Sankey module to connect starting and ending variables with a third line-weight variable. Small categories remain available with cautions for interpretation.
Full sample outcomes
Financial Stress Scale — Full sample
Average score on a 1–5 scale. Higher values indicate greater financial stress.
Overall3.50
Full samplen=1682
3.50
View exact original values and respondent counts
Financial Stress Scale — Full sample
Group
Mean
Median
Valid n
Caution
Full sample
3.50
3.60
1682
—
How to read this: Results are unweighted and descriptive. They do not establish causation or indicate that differences are statistically significant.
Percentages and averages use valid responses for the selected outcome; denominators therefore vary. Interview quotations elsewhere on this site provide context and are not assigned to demographic subgroups selected here.
Build a weighted relationship
Create a Sankey flow
Choose a starting variable and an ending variable, then choose a third variable to weight the connections. Each line is divided by the weight variable’s categories, and its thickness shows the number of respondents in that category.
Node order: Starting and ending categories are arranged from the highest selected value at the top to the lowest at the bottom. Percentages use the included-record denominator.
Included records: 1,605 respondents have valid values for all three variables and match the selected weight categories.
Interpretation and caution: Color identifies the weight category and line thickness represents its respondent count; neither implies causation or time order. An asterisk marks a node with n≤15. Dashed connections also contain n≤15. These small-sample results may be unstable and should be interpreted cautiously.
Downloadable survey visual
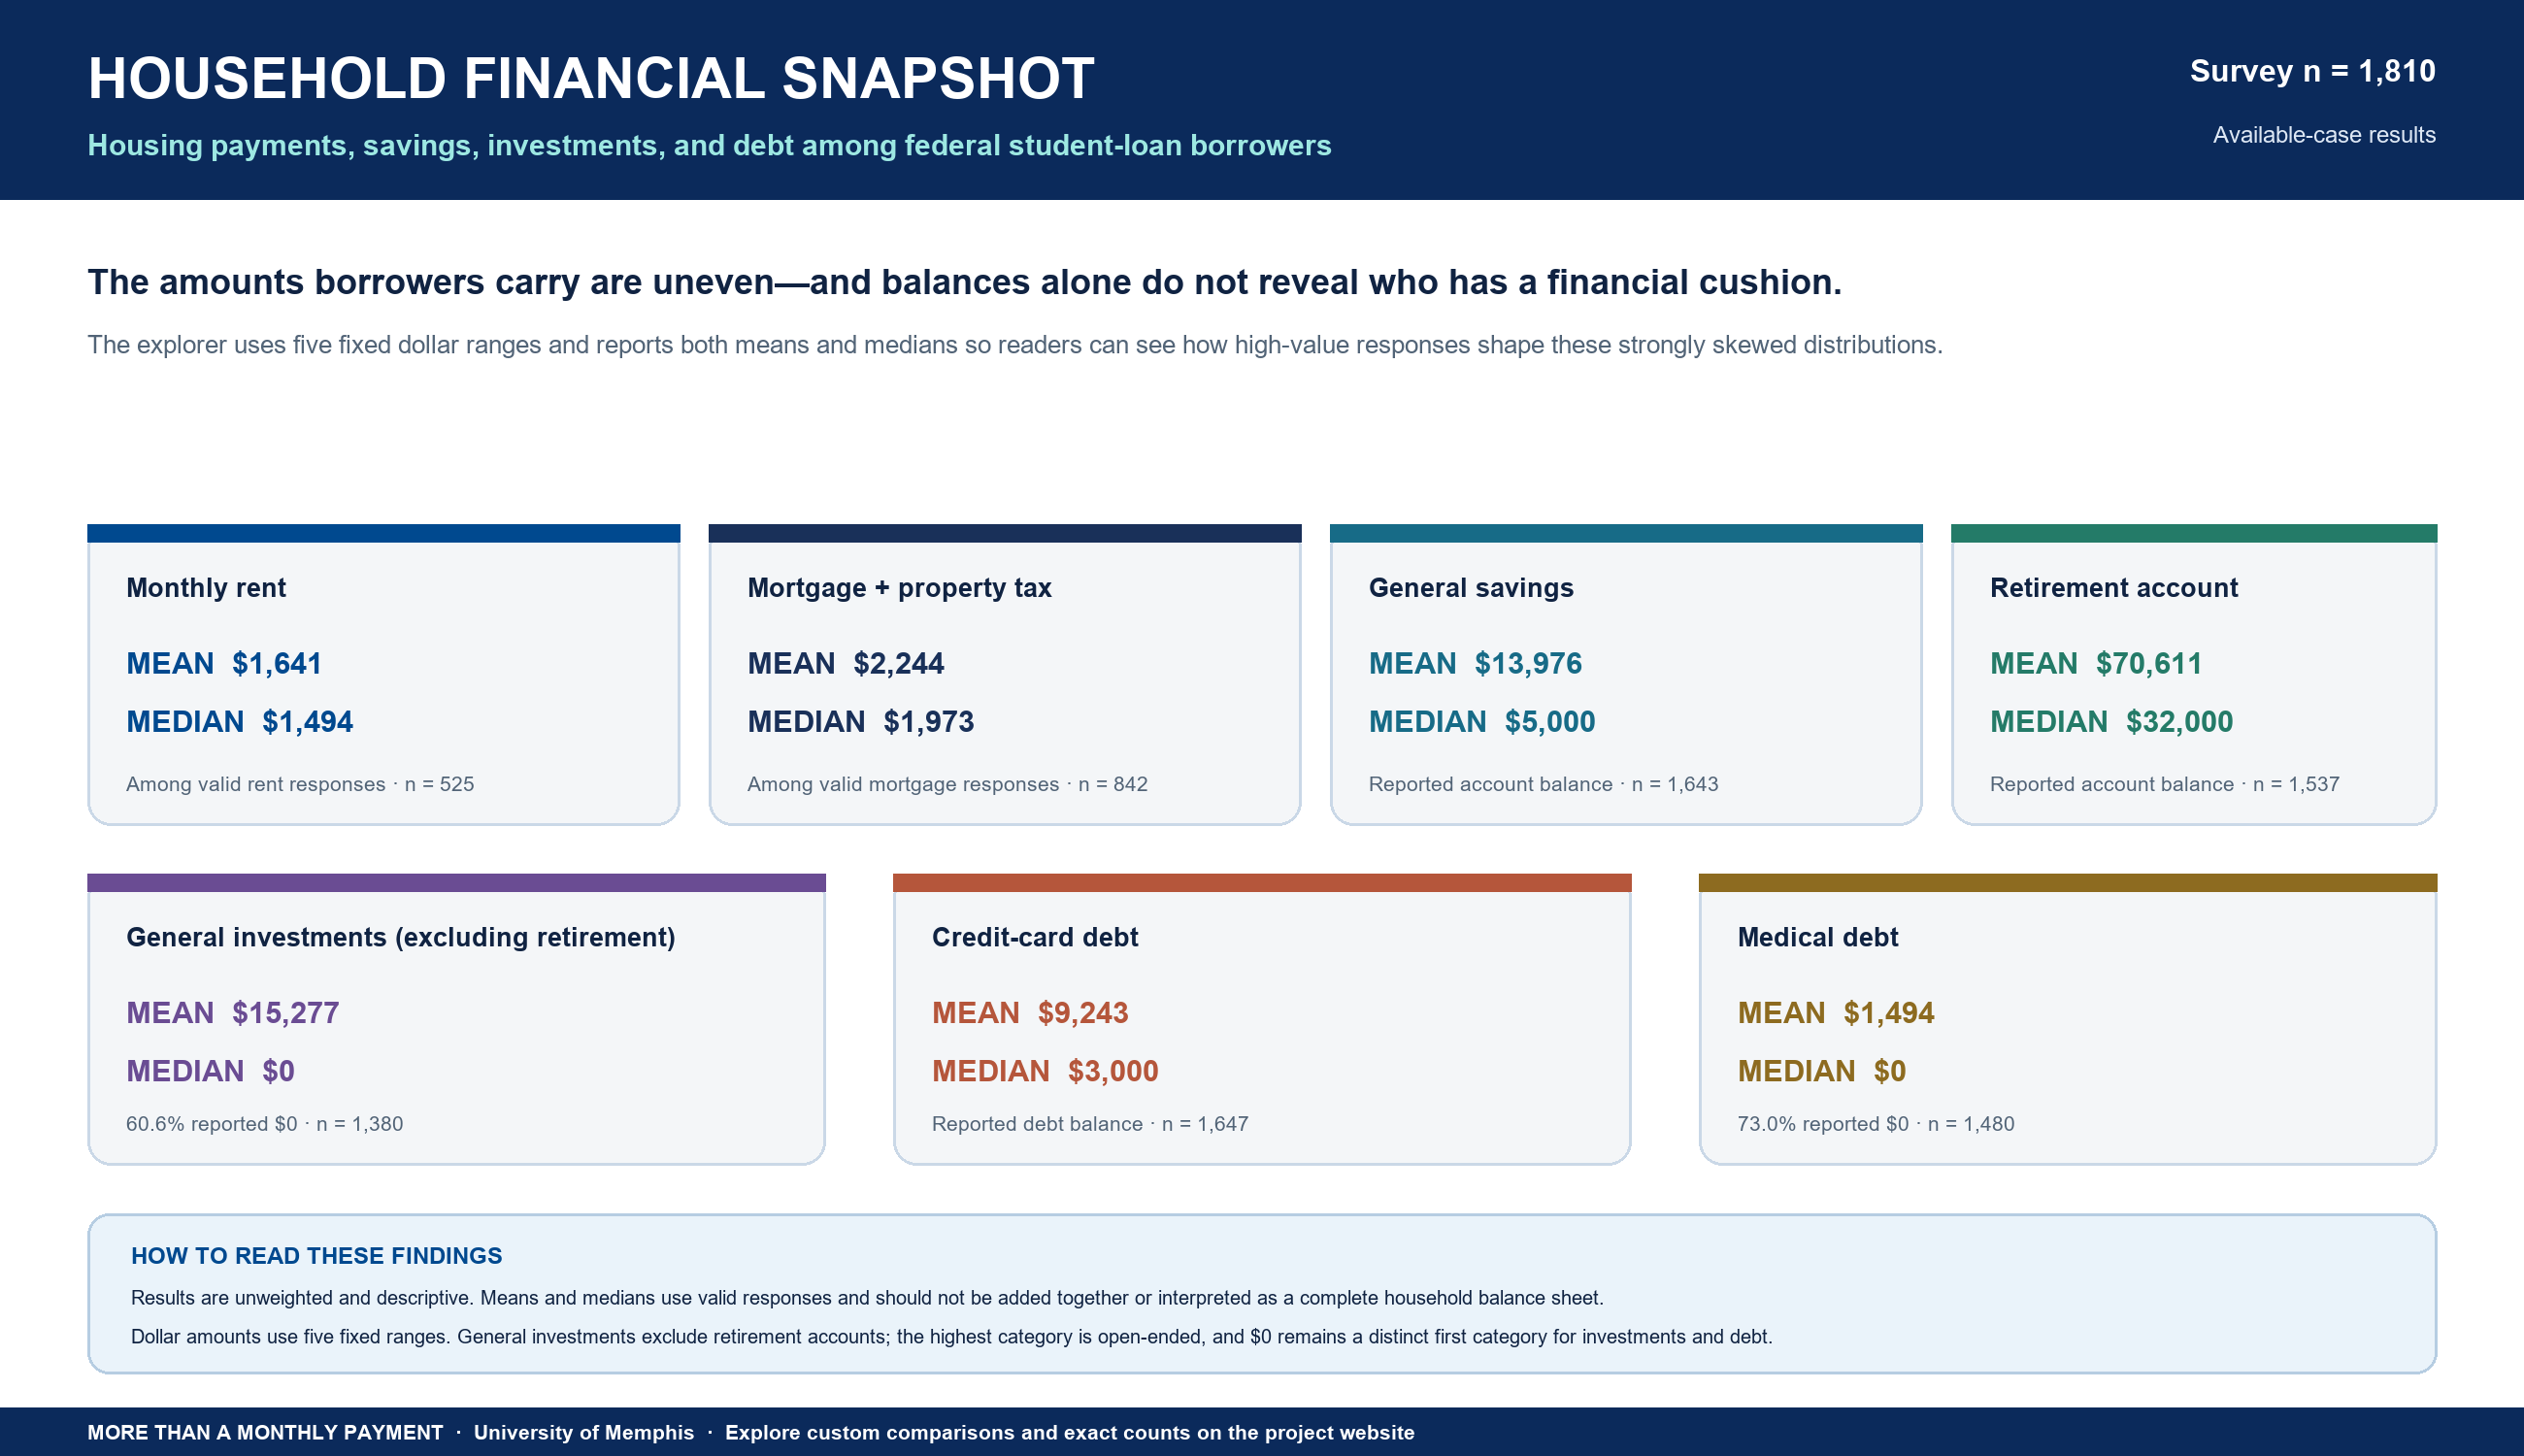
Payments, savings, investments, and debt
A press-ready overview of seven financial measures, with means, medians, valid response counts, and interpretation notes.
PNG · survey snapshot
Household Financial Snapshot
Mean and median housing payments, account balances, and debts, plus the shares reporting no general investments outside retirement accounts or no medical debt.